Hiding In Plain Sight: Astronomers Find New Type Of Stellar Object
“They missed it because they hadn’t expected to find anything like it.” 2023 July 19, Nature
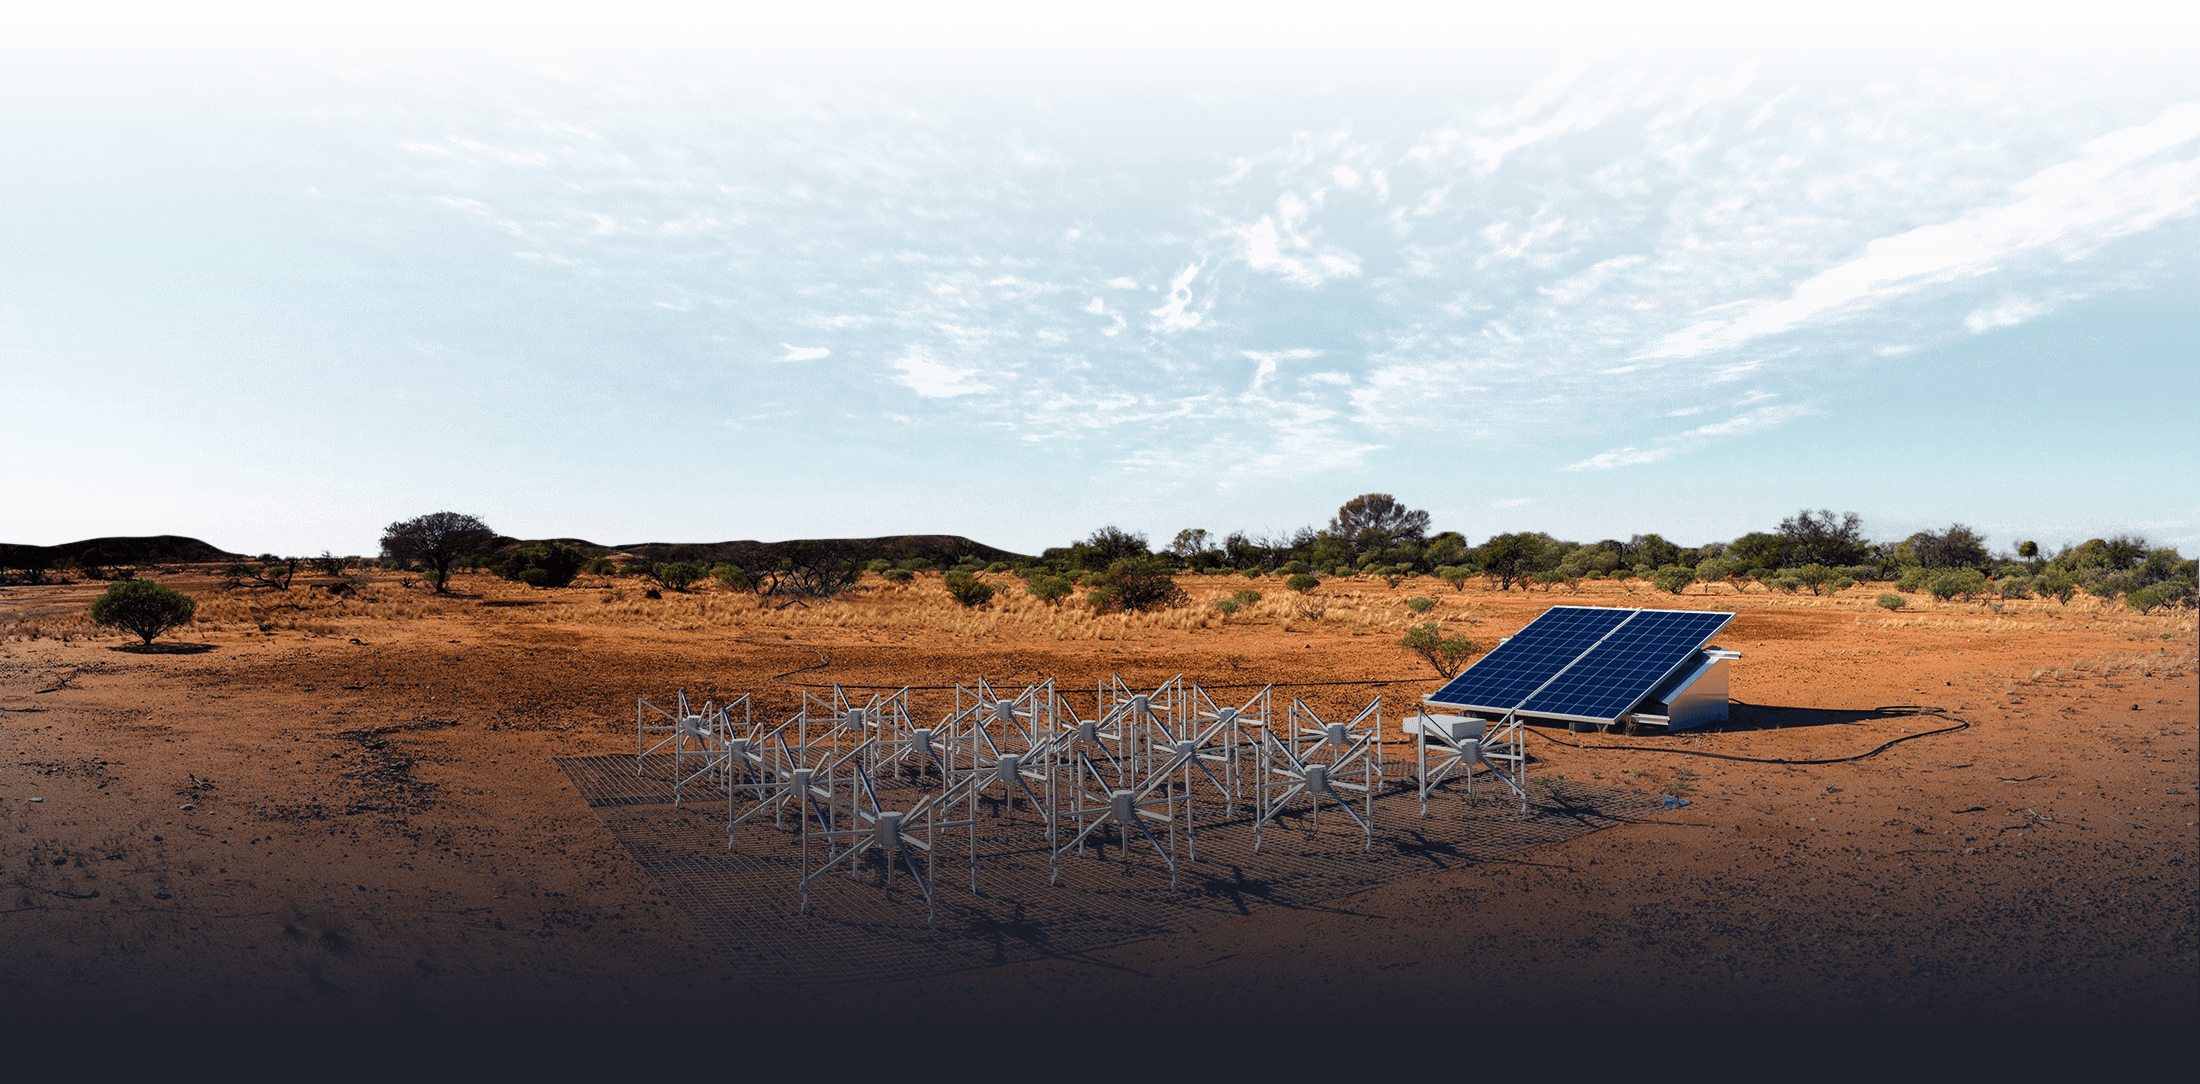
Read MoreThe GLEAM survey covers the entire sky south of Dec +30. A description of the science motivations and survey methodology for GLEAM can be found in the GLEAM Survey definition paper by Wayth et al. (2015). As has been previously demonstrated in Hurley-Walker (2014), meridian drift scans are an effective surveying technique for the MWA and we re-use the basic strategy for GLEAM. The sky is divided into seven strips in Declination and five frequency ranges as summarised below. The Declinations are chosen such that the peak in the primary beam response for a given setting corresponds approximately to the half power point of the neighbouring beam along the meridian at 150 MHz.
The instantaneous frequency coverage of the MWA is 30.72 MHz, so the frequency range between 72 and 231 MHz is divided into five bands that provide near contiguous coverage, but avoid the band around 137 MHz that is contaminated by satellite interference. The observing was executed as a series of week-long campaigns where a single Declination setting is observed in a night, covering a strip between approximately 8 and 10 hours in length, depending on the time of year. The Sun can be bright and time-variable at MWA frequencies, so observations were only performed at night. Within a night, the observing was broken into a series of 120 s scans for each frequency, cycling through all five frequency settings over 10 minutes. Within a scan, typically 108 s of usable data were collected. Every 2 hours throughout the night, a calibration field was observed over all five frequency settings, again as a set of 120 s scans totalling 10 minutes.
GLEAM observing began in August 2013 and the first year concluded in July 2014. The second year of observing took data at HA +/- = 1 and concluded in July 2015. A bonus third year of observing at high (~250-310MHz) frequency was also performed, and concluded in July 2016.
Each Declination strip of GLEAM is calibrated using a single primary calibrator and then self-calibrated to remove residual amplitude and phase errors. The wide primary beam of the MWA is modelled and calibrated out, and the flux scale is tied to existing catalogues.
The first release images from the GLEAM survey (Wayth et al. 2015) cover the extragalactic sky (minus the Galactic plane) these are available via SkyView. Details of the image processing are given in Hurley-Walker et al. (2017)
The associated extragalactic catalogue (Hurley-Walker et al. (2017)) is available at VizieR and will eventually be available in NED (cross-matching 300,000+ sources correctly takes several months).
The postage stamp FITS files from the same catalogue are available at from the ICRAR VO service.
Use the new python API for large-scale image queries.
The GLEAM visibility data are now public and can be downloaded from the MWA node of the All-Sky Virtual Observatory.
The first GLEAM release was optimised for the study of compact extragalactic sources (contact Natasha Hurley-Walker for information on the first GLEAM release: nhw@icrar.org). Future GLEAM releases will cover the Galactic Plane as well as provide data products tailored for examination of diffuse and extended sources.
| Survey Name | Frequency Range | Sensitivity | Angular resolution | Sky area |
| (MHz) | (mJy/beam) | (arcsec) | (sq deg) | |
| GLEAM | 74 – 231 | 6 – 10 | ~100 | 30,000 |
| MSSS-LBA | 30 – 74 | ~15 | ~100 | 20,000 |
| VLSS | 74 | 100 | 80 | 30,000 |
| MSSS-HBA | 120 – 160 | ~5 | ~120 | 20,000 |
| TGSS | 150 | 2 – 5 | 25 | 37,000 |
| MWACS | 120 – 180 | 50 | ~180 | 6,100 |
| MRC | 408 | ~150 | ~100 | 24,000 |
| SUMSS | 843 | 1 | 45 | 8,100 |
| NVSS | 1400 | 0.45 | 45 | 35,000 |
| Pointing Declinations (deg) | -72, -55, -40.5, -26.7, -13, +1.6, +18.3 |
| Central Frequencies (MHz) | 87.68, 118.4, 154.24, 184.96, 215.68 |
| Frequency resolution (kHz) | 40 (first year), 10 (second year) |
| Time resolution (s) | 0.5 (first year), 2 (second year) |
GLEAM is available in the Google Play store for Android phones and tablets.
The GLEAMOSCOPE tool is also available, to take a tour of the universe at different frequencies.
MWA astronomers are leading the way at low frequencies – read up on the latest news.
“They missed it because they hadn’t expected to find anything like it.” 2023 July 19, Nature
Read MorePhD candidate Kathryn Ross has co-won the 2022 WA science student of the year award! Ross’s research using the MWA telescope has helped shed light on our understanding of galaxy evolution. 2022 August 30, ICRAR
Read MoreA team mapping radio waves in the Universe has discovered something unusual that releases a giant burst of energy three times an hour. 2022 January 27, Nature
Read More2021 December 23, Nature Astronomy
Read More2021 March 18, ICRAR, IFL Science, Medium, Science News, Popular Mechanics
Read MoreThe blast is about five times bigger than the previous record holder. 2020 March 4, Nature World News,
Read MoreUsing the GLEAM surveym Dr Hurley-Walker and her colleagues discovered the remnants of 27 massive stars that exploded in supernovae at the end of their lives. 2019 November 20, ICRAR and ABC news
Read MoreOur broad themes of investigation, driving new scientific discoveries with the MWA.